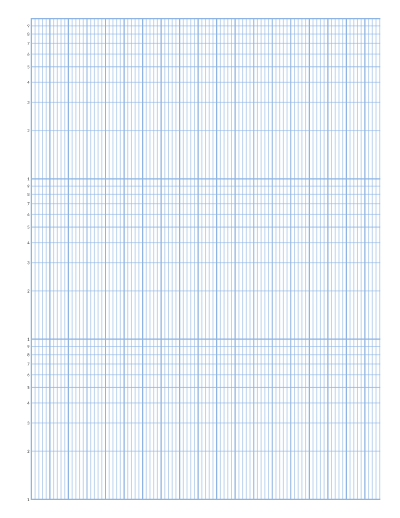
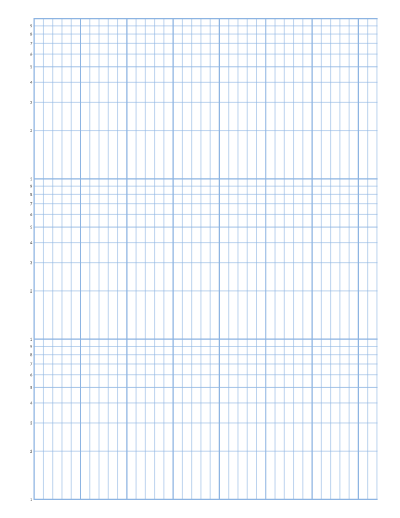
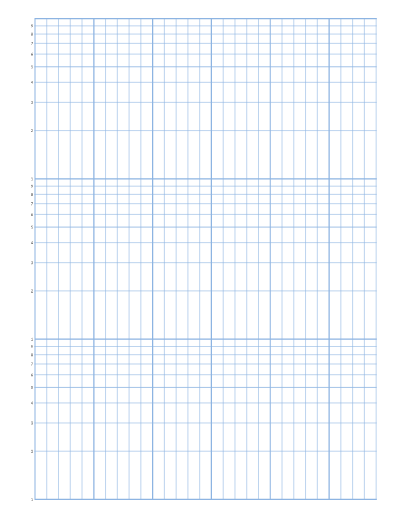
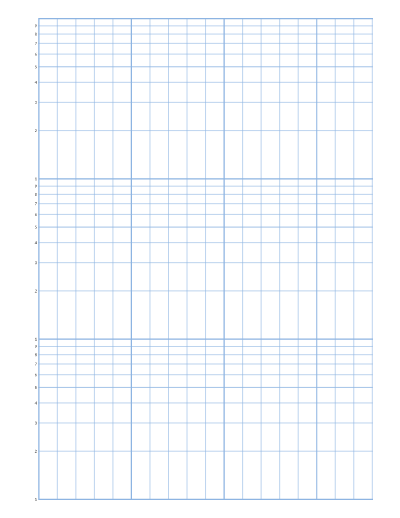
What is semi-log graph paper?
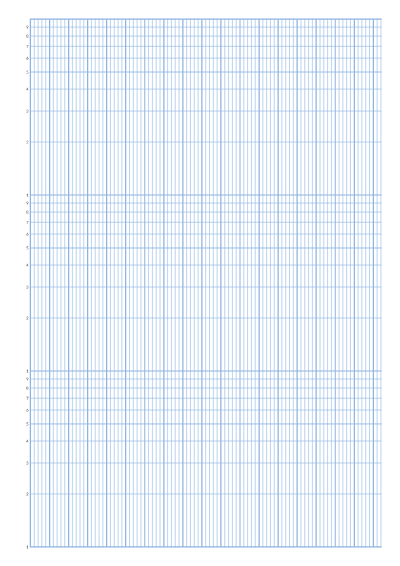
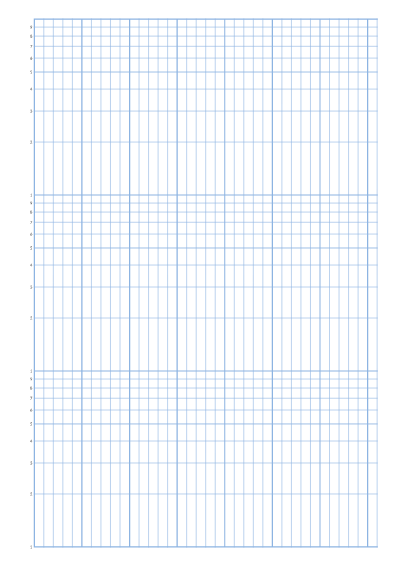
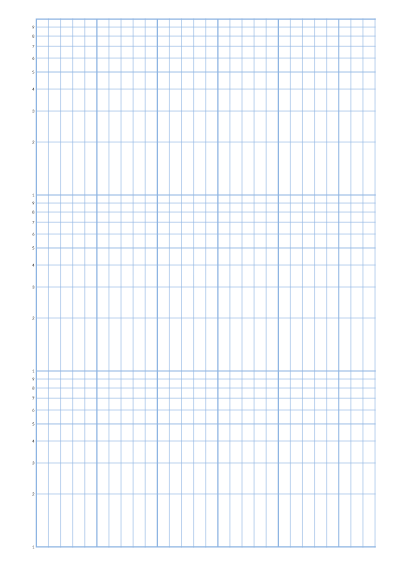
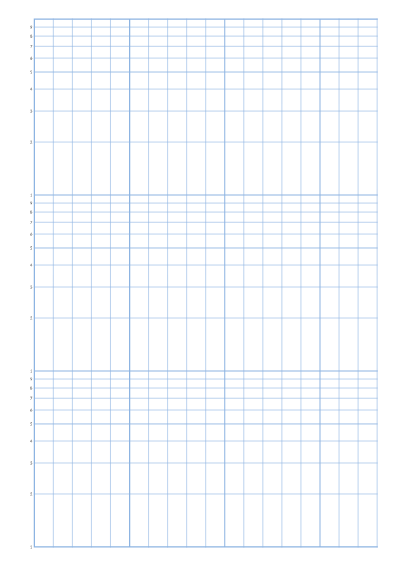
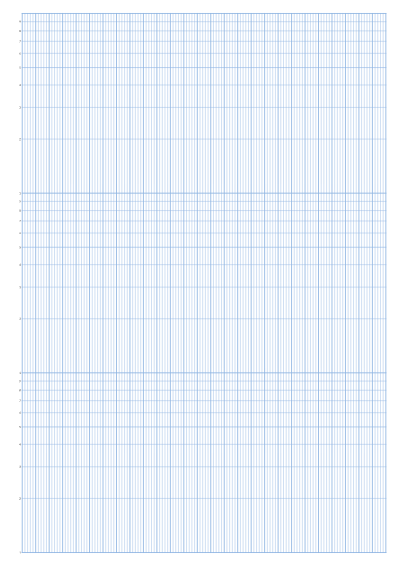
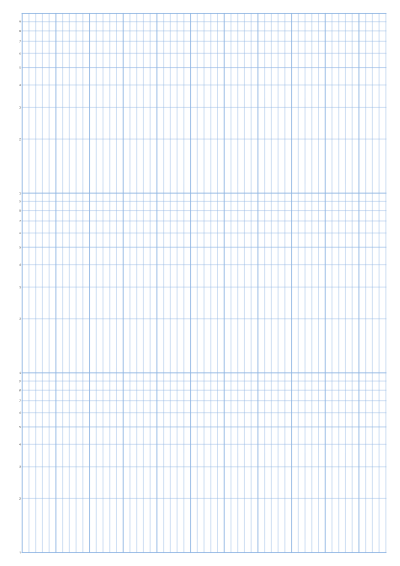
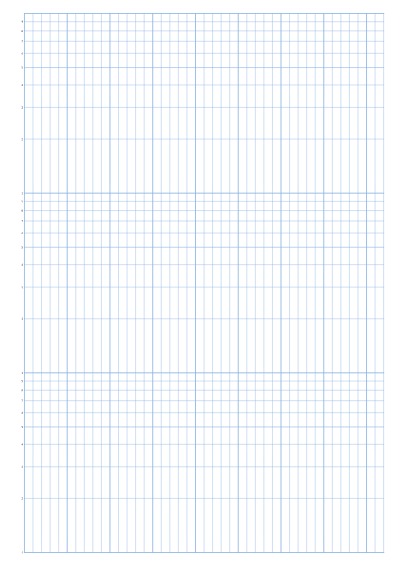
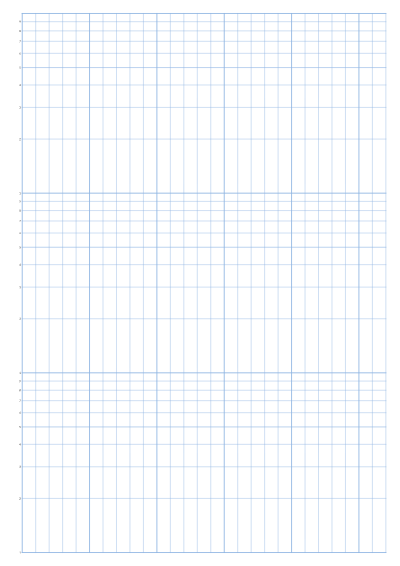
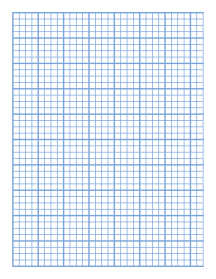
Semi-logarithmic graph paper, also called semi log paper, has one linear axis and one logarithmic axis. Along the linear axis the lines are evenly spaced, as on ordinary graph paper. Along the logarithmic axis the lines are spaced by the logarithm of the value, so they crowd together towards the top of each cycle. Each repeating block is called a cycle (or decade) and covers a tenfold change: 1 to 10, then 10 to 100, then 100 to 1000.
How to read a log cycle
Within one cycle the printed lines mark 1 through 9, and the next cycle starts at 10 times the first. Distances are proportional to log₁₀ of the value, measured from the bottom of the cycle:
| Value | Distance up the cycle |
|---|---|
| 1 | 0% |
| 2 | 30% |
| 3 | 48% |
| 4 | 60% |
| 5 | 70% |
| 6 | 78% |
| 7 | 85% |
| 8 | 90% |
| 9 | 95% |
| 10 | 100% |
That is why the gap between 1 and 2 is so much larger than the gap between 8 and 9. To read a value between two printed lines, estimate by eye on the log scale rather than halving the distance. The printed numbers only give the digits 1 to 9, so write your own scale next to the axis: for example 1, 10 and 100 at the heavy lines.
When to use semi-log paper
Plot data on a semi-log axis when it changes by multiples rather than by steps. If y = a·bˣ (exponential growth or decay), then log y is a straight line in x, so exponential data forms a straight line on semi-log paper. Typical uses are population growth, compound interest, radioactive decay, bacterial counts and frequency response (use the Horizontal axis for frequency). If both axes span several decades, or the data follows a power law, choose Both (log-log) instead of one log axis; the same sheet becomes log-log graph paper.
How many cycles do I need?
Divide your largest value by your smallest and count the powers of ten. Data from 3 to 40,000 spans about four cycles, so choose 5 for some spare room. Choose fewer cycles for a taller scale and easier reading, because each cycle is stretched to fill the page. For a lab report, 2 or 3 cycles often suffice.
Printing at true size
Every sheet fills the page from margin to margin, so the length of a cycle depends on the number of cycles and the paper size. Print at 100% or Actual size, never “Fit to page”, or the evenly spaced linear lines will drift. See the print at actual size guide for each browser. If you also need numbered x and y axes on a linear grid, use coordinate plane graph paper, or choose a finer linear grid under More options. For circular data, try polar graph paper.
Frequently asked questions
Why does exponential data look like a straight line?
Taking the logarithm of y = a·bˣ gives log y = log a + x·log b, which is a straight line in x. The semi-log axis does that logarithm for you, so you can read the growth rate from the slope.
How do I read values between the printed lines?
Estimate the position on the log scale. A point halfway between the lines for 2 and 3 is not 2.5; it is closer to 2.45. Use the table above, or work out the value with a logarithm.
Can I print log-log graph paper here?
Yes. Under Log axis, choose Both (log-log). Both axes then use the same number of cycles, and the linear grid is removed.
How many cycles are on the paper?
Choose 1 to 5 cycles per axis. Each cycle always spans a factor of ten.